Processing OS Mastermap topography dataset

OS MasterMap Topography Layer is the most detailed and accurate view of Great Britain’s landscape – from roads to fields, to buildings and trees, fences, paths and more. It contains over 470,000,000 topographic identifiers (TOIDs) providing the user with a unparalleled view of Great Britain. With this sheer volume of detail comes ALOT of data and this post will explore two tools for uploading the whole dataset into PostgreSQL.

The product normally comes on a set of CD-ROMs (11 for the whole dataset) and it is essential that you get hold of the Feature validation Dataset (FVDS) which provides a list of all the TOID’s so you can cross reference with what has been uploaded.

I have also created a layer that contains 1x1km grid squares that have OS MasterMap topography data (244,583 in total) by using a combination of this free tool and the OS 1km price matrix. This is useful as a reference to check you have the data everywhere you should do and also if you need to use the grid squares as a search mechanism for the data.

You can download this layer from here.

OS Translator II

Developed by Lutra consulting and available as a QGIS plugin, this tool provides a simple GUI for uploading data. It allows data to be uploaded with styles and provides postgres setup details to optimise the speed of upload. The downside is that the tool only supports create or replace (not APPEND) which implies COUs might not load consistently.

To use you need to be connected to your postgres database through the QGIS DB manager. You are presented with a variety of options: you will definitely want to create a spatial index and remove duplicates because we are dealing with geographic chunks of data. The last two options relate to styling the layer and it is recommended to select these aswell. Two additional fields will be added allowing you to style the layer with either ESRI, Geoserver or QGIS stylesheets. In the right window you can also select the fields you want to be entered – the less you select the quicker the upload but at the cost of losing data.

OS translator tool

I had one issue with the styling and had to add these fields after the initial upload. I believe this was to do with the svg path not being correct (as mentioned here. If you experience the same issues then just download the SQL scripts for schema 7 here and schema 9 here. Note, you will need the array SQl scripts as items under the styling columns are stored in array’s.

You can see the visual difference between schema 7 (bottom) and schema 9 (top) below:

OS translator tool

OS translator tool

Astun loader

The Astun loader has one significant advantage (it can append records meaning COUs can be handled) and one significant disadvantage (it’s alot slower) than the OS translator. Therefore, you could use the OS translator to get the whole dataset in PostgreSQL and then use Astun to handle the COU’s for example.

This tool allows GML/KML data in general (OS Mastermap is GML) to be transferred to any format compatible with OGR – in this case we will transfer the data into PostgreSQL. To be this we need to create a config file, some examples are provided here. The one I used is presented below:

# Note: Environment variables can be used with any of
# the options by using a token of the form:
# $HOME, ${HOME} or %TEMP% (Windows only)

# The directory containing your source files.
# All supported files in the specified directory and
# it's descendants will be loaded.
src_dir=/home/brainnwave_nathan/Desktop/hp/2255669-HP4500-5c11.gz

# The directory used to store the translated data
# if writing to a file based format such as ESRI
# Shape, MapInfo TAB etc.
out_dir=/home/brainnwave_nathan/Desktop/Output

# The directory used to store temporary working files
# during loading.
tmp_dir=/home/brainnwave_nathan/Desktop/temp

# The ogr2ogr command that will be used to load the data.
# Here you can specify the destination format and any
# associated settings (for example database connection
# details if you are writing to PostGIS).
# As well as environment variables the following tokens can
# be used which will be substituted at runtime:
# $output_dir - the directory specified by the out_dir setting
# $base_file_name - the file name of the file to be loaded
# $file_path - the full path of the file to be loaded
ogr_cmd=ogr2ogr --config GML_EXPOSE_FID NO -append -skipfailures -f PostgreSQL PG:'dbname=brainnwave active_schema=public host=12.34.56.78 user=postgres password=abcdefghij' $file_path

# The command used to prepare the source
# data so it is suitable for loading with OGR. Choose a prep
# class appropriate for your data, for Ordnance Survey
# products take a look at prep_osgml.py for the available classes.
prep_cmd=python prepgml4ogr.py $file_path prep_osgml.prep_osmm_topo

# An optional command to be run once OGR has created it's output.
# Called once per file, useful for loading SQL dump files etc.
# All of the tokens available to the ogr_cmd can be used here.
post_cmd=

# Optional OGR .gfs file used to define the
# feature attributes and geometry type of
# the features read from the GML.
gfs_file=../gfs/osmm_topo_postgres.gfs

# Whether to output debug messages and keep
# temporary files (True or False).
debug=True

Once the data is loaded, the SQL scripts to append style fields still have to be run to allow the use of stylesheets.

GDAL / OGR cheatsheet

A wonderful cheatsheet for using GDAL and OGR – taken from Derek Watkins GitHub page

Vector operations

Get vector information

ogrinfo -so input.shp layer-name

Or, for all layers

ogrinfo -al -so input.shp

Print vector extent

ogrinfo input.shp layer-name | grep Extent

Continue reading

Open Layers web map development with Geoserver

The last few months, I have been learning the basics of OpenLayers 3.6. This has involved learning to setup a map, import layers from various sources and add feature overlays.

The screenshots below show where I am at: I have a few layers (one geojson, WMS on my own geoserver and a WMS on a public geoserver) which can be switched on and off and a feature overlay for the Countries layer, providing the user with some relevant information. Screenshots can be seen below.

tool_crop

All layers on, with feature overlay on France and text occuring in bottom right hand of screen.

tool_crop

Counties layer (my geoserver) switched off, with additional feature overlay styling upon specified zoom layer.

tool_crop

Streams layer (public geoserver) and OSM base map switched on, other layers off.

Source code can be seen below:

Continue reading

Calculating number of overlaps between polygons

A common application within GIS is to create buffer / catchment areas – an interesting analysis is then to see how many overlaps occur with the each catchment indicating whether a site is under or over provisioned. This can be achieved using Postgis and the following fantastic tutorial.

This can you allow you to produce maps like the following:

pastedImage

Below gives a snapshot of the process:

create table boundaries_allot as select ST_Union(ST_ExteriorRing(geom)) from
(select (ST_DumpRings((st_dump(geom)).geom)).geom as geom from allotment_buffer) q 

This has been altered from the tutorial to include multi polygons. ST_Dump breaks down multi polygons into single polygons and ST_DumpRings provides the interior and exterior rings of polygons (for complex polygons)

CREATE SEQUENCE polyseq_allots;
CREATE TABLE polys_allots AS
SELECT nextval('polyseq_allots') AS id, (ST_Dump(ST_Polygonize(st_union))).geom AS geom
FROM boundaries_allot;

This creates individual polygons for each multi-linestring and uses ST_Dump to switch any multi polygons to single polygons.

ALTER TABLE polys_allots ADD COLUMN count INTEGER DEFAULT 0;
UPDATE POLYS_allots set count = p.count
FROM (
  SELECT count(*) AS count, p.id AS id  
  FROM polys_allots p 
  JOIN allotment_buffer c 
  ON ST_Contains(c.geom, ST_PointOnSurface(p.geom)) 
  GROUP BY p.id
) AS p
WHERE p.id = polys_allots.id;

Once we have the individual polygons, by using the centroids of the new small polygons with the set of original circles, we can calculate how many circles contain each centroid point.

CSV kit

A very useful piece of software for working and analysing csv files is csvkit. A few useful functions are the following which have been taken from the above link.

Shows you stats about the file (e.g. col names, type, nulls, min, max, median, std deviation, unique values, most frequent)

$csvstat myfile.csv

Peak at excel file to display in terminal

$in2csv myfile.xlsx
$in2csv myfile.xlsx > myfile.csv  # can write xlsx file to csv by chaining operations

Look at data, formats nicely with borders

$csvlook myfile.csv,

See column names

$csvcut -n myfile.csv

Cut out specific columns

$csvcut -c 2,5,6 myfile.csv  # Cut out columns to just 2,5,6
$csvcut -c col1,col2,col3 myfile.csv  # can also specify by name (make sure not to leave spaces)

Chain commands to pass data along using the pipeline symbol |

$csvcut -c RespondentID,CollectorID,StartDate,EndDate Sheet_1.csv | csvlook | head

Find cells matching a regular expression (e.g. pattern “ddd-123-dddd”)

$csvgrep -c phone_number -r "\d{3}-123-\d{4}" mydata.csv > matchrx.csv

Merge csv files together so you can do aggregate analysis (assuming they have the same headers)

$csvstack firstfile.csv secondfile.csv > combinedfile.csv
# You can add an additional '-g' flag on csvstack to add a 'grouping column' (e.g. it'll say firstfile, secondfile)

Execute a SQL query directly on a CSV file

$csvsql --query "SELECT * FROM mydata WHERE AGE > 30" mydata.csv > query_results.csv

Sort data using csvsort

$csvcut -c StartDate,EndDate myfile.csv | csvsort -c StartDate | csvlook | head  # use -r to reverse order (i.e. desc) for csvsort

# Execute a SQL query by referencing two CSV files and doing a SQL Join
$csvsql --query "select m.usda_id, avg(i.sepal_length) as mean_sepal_length from iris as i join irismeta as m on (i.species = m.species) group by m.species" examples/iris.csv examples/irismeta.csv

Generate a create table statement for your csv data

$csvsql -i sqlite myfile.csv  # Can specify type of db with '-i' flag, other db's include mysql, mssql

Join to csv’s on common column header

$ csvjoin -c fips data.csv acs2012_5yr_population.csv > joined.csv

Automatically create a SQL table and import a CSV into the database (postgresql)

$createdb dbname
$csvsql --db postgresql://username:password@localhost:port/dbname --insert mydata.csv
$psql -q dbname -c "\d mydata"  # shows table, col names, data types
$psql -q dbname -c "SELECT * FROM mydata"

Extract a table from a SQL database into a CSV

sql2csv --db postgresql://username:password@localhost/dbname --query "select * from mydata" > extract.csv
sql2csv --db mssql://username:password@servername/dbname --query "select top 100 * from [dbname].[dbo].[tablename]" > extract.csv

Conduct analysis on csv in python

$ csvpy data.csv
Welcome! "data.csv" has been loaded in a CSVKitReader object named "reader".
>>> print len(list(reader))
1037
>>> quit()

Time-series analysis of albedo on the Agassiz Ice Cap, Canada

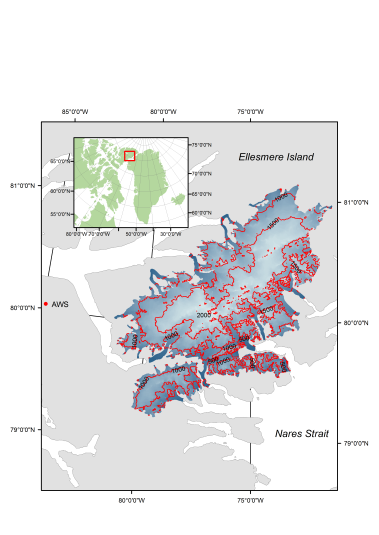
The final glacier analysed was the Agassiz Ice Cap (AIC) shown in Fig. 1.

agassizSS

Figure 1: Study site map for Agassiz Ice Cap. Coordinates refer to UTM (Universal Trans Mercator)
zone 18N. Contour spacing is marked at 500 m and AWS refers to the automatic weather station from which
data was collected. The inset shows shows the location of AIC within the Canadian  Archipelago with coordinates referring to the NSIDC sea ice polar stereographic north system.

The results were broken down into three sections. Firstly, daily albedo measurements provide an overview of the behaviour of albedo throughout the melt season and allow short term fluctuations from the norm to be quantified (Fig. 2).

agassizEvolution

Figure 2: Seasonal evolution of daily albedo on AIC.

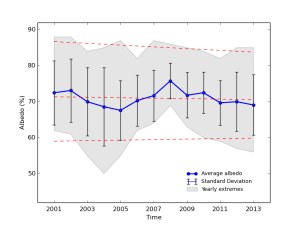
Secondly, yearly averages were calculated including maximum and minimums (Fig. 3).

agassizSDMaxMinFinal

Figure 3: Yearly evolution of albedo on AIC.

Continue reading

Time series analysis of albedo on Humboldt Glacier, Greenland


Following on from the previous post, the second glacier analysed was the Humboldt Glacier (HG) shown in Fig. 1; the largest in Greenland. This was used to provide method validation with Box et al (2012), which encompassed the whole of the Greenland Ice Sheet (GrIS), as well as a more detailed and localised analysis of individual glacier albedo behaviour. A small yearly discrepancy of 0.0006 was seen which provides confidence in the methods to replicate both short and long – term albedo variability.

Figure 1: Study site map for Humboldt Glacier. Coordinates refer to UTM (Universal Trans Mercator)
zone 20N. Contour spacing is marked at 200 m and AWS refers to the automatic weather station from which
data was collected. The inset shows shows the location of Humboldt Glacier within Greenland and the
Canadian Archipelago with coordinates referring to the NSIDC sea ice polar stereographic north system.

The results were broken down into three sections. Firstly, daily albedo measurements provide an overview of the behaviour of albedo throughout the melt season and allow short term fluctuations from the norm to be quantified (Fig. 2).

Figure 2: Seasonal evolution of daily albedo on HG.

Secondly, yearly averages were calculated including maximum and minimums (Fig. 3).

Figure 3: Yearly evolution of albedo on HG.

Finally, regional maps were created highlighting the spatial relationship of albedo fluctuations throughout the time series (Fig. 4).

Figure 4: Regional evolution of albedo on HG.


Key points from these figures are as follows:

  •  Average albedo across the glacier (αyearly) is decreasing at a rate of 0.0042 ± 0.0011 year-1 with minimum and maximum trends following suit.
  • Analysing average monthly albedo shows that June and July were largely responsible for yearly declines with July albedo decreasing at rate twice that of αyearly (0.0086 ± 0.0023 year.-1). Almost no trend existed for August and September.
  • Regionally 87% of the glacier has seen a decline in albedo.
  • Two seasons saw significant deviations (σ) from daily average albedo (αdaily) with mid-June to early-August 2008 measuring 1 σ below, and early-June to mid-August 2012 measuring 2 σ below at peak melt.
  • Daily melt season anomalies, defined as > 1 σ below αdaily, were five times more common in the period 2008 – 2013 than 2001 – 2007.
  • Albedo standard deviations are at their largest during times of higher melt.

References: Box, J. E., Fettweis, X., Stroeve, J., Tedesco, M., Hall, D., Ste en, K., 2012. Greenland ice sheet albedo feedback: thermodynamics and atmospheric drivers. The Cryosphere 6 (4), 821 – 839.

Time-seies analysis of albedo on Svalbard (Part 2)

Further analysis involved calculating yearly averages as well as the spatial representation of albedo change across Austfonna.

svalbardSDMaxMinFinalaustfonnaAverageQGISFinal


Key points from these figures are as follows:

  • Yearly averages (αyearly) disclose no overall trend, but this masks an almost sinusoidal pattern whereby early and late trends cancel one another. Initial multi-year decline of 0.018 ± 0.0034 year􀀀-1is halted in 2005. Increases are then seen until 2008, whereby another significant forcing reversed the trend once again,into a decreasing trend at 0.0194 ± 0.0029 year􀀀-1.
  • Average monthly albedos also show a slight change in pattern from the eastern Arctic glacier’s with July not providing the greatest proportion of albedo decline and June the only month showing any real decline (0.0063 ± 0.0016 year􀀀-1).
  • Regionally 86% of the glacier has seen a decline in albedo.
  • In contrast to Humboldt Glacier, αdaily exhibits greater short term variability throughout June, July and August. Defining an extreme variance shift as a five unit swing over a period of 3 days, the current declining period (2008 – 2013) has 41 shifts, compared to 16 on Humboldt Glacier